User Interface
Dagger Cloud lets you visualize your Dagger pipelines in two ways: runs and changes.
Runs
A run is an invocation of a Dagger pipeline. When you run Dagger in CI, each call aligns with one run in Dagger Cloud. If you have many CI jobs configured to run for every pull/merge request, you may see several runs for a single commit.
For instance, if 4 GitHub Actions workflows each call Dagger to run a pipeline for pull requessts, you will see four distinct runs in the Dagger Cloud UI. You may also see multiple runs if one GitHub workflow has multiple jobs defined with distinct calls to Dagger to run your pipelines. As you Daggerize your pipelines, you will likely have fewer distinct CI workflows.
Because Dagger Cloud understands the Dagger engine's data model, it gives you visibility into the steps of your pipeline's Directed Acyclic Graph (DAG), including detailed logs for each step.
The Dagger team is working on a new user experience to group your Dagger runs by the pull or merge request (group commits by PR/MR).
All Runs page
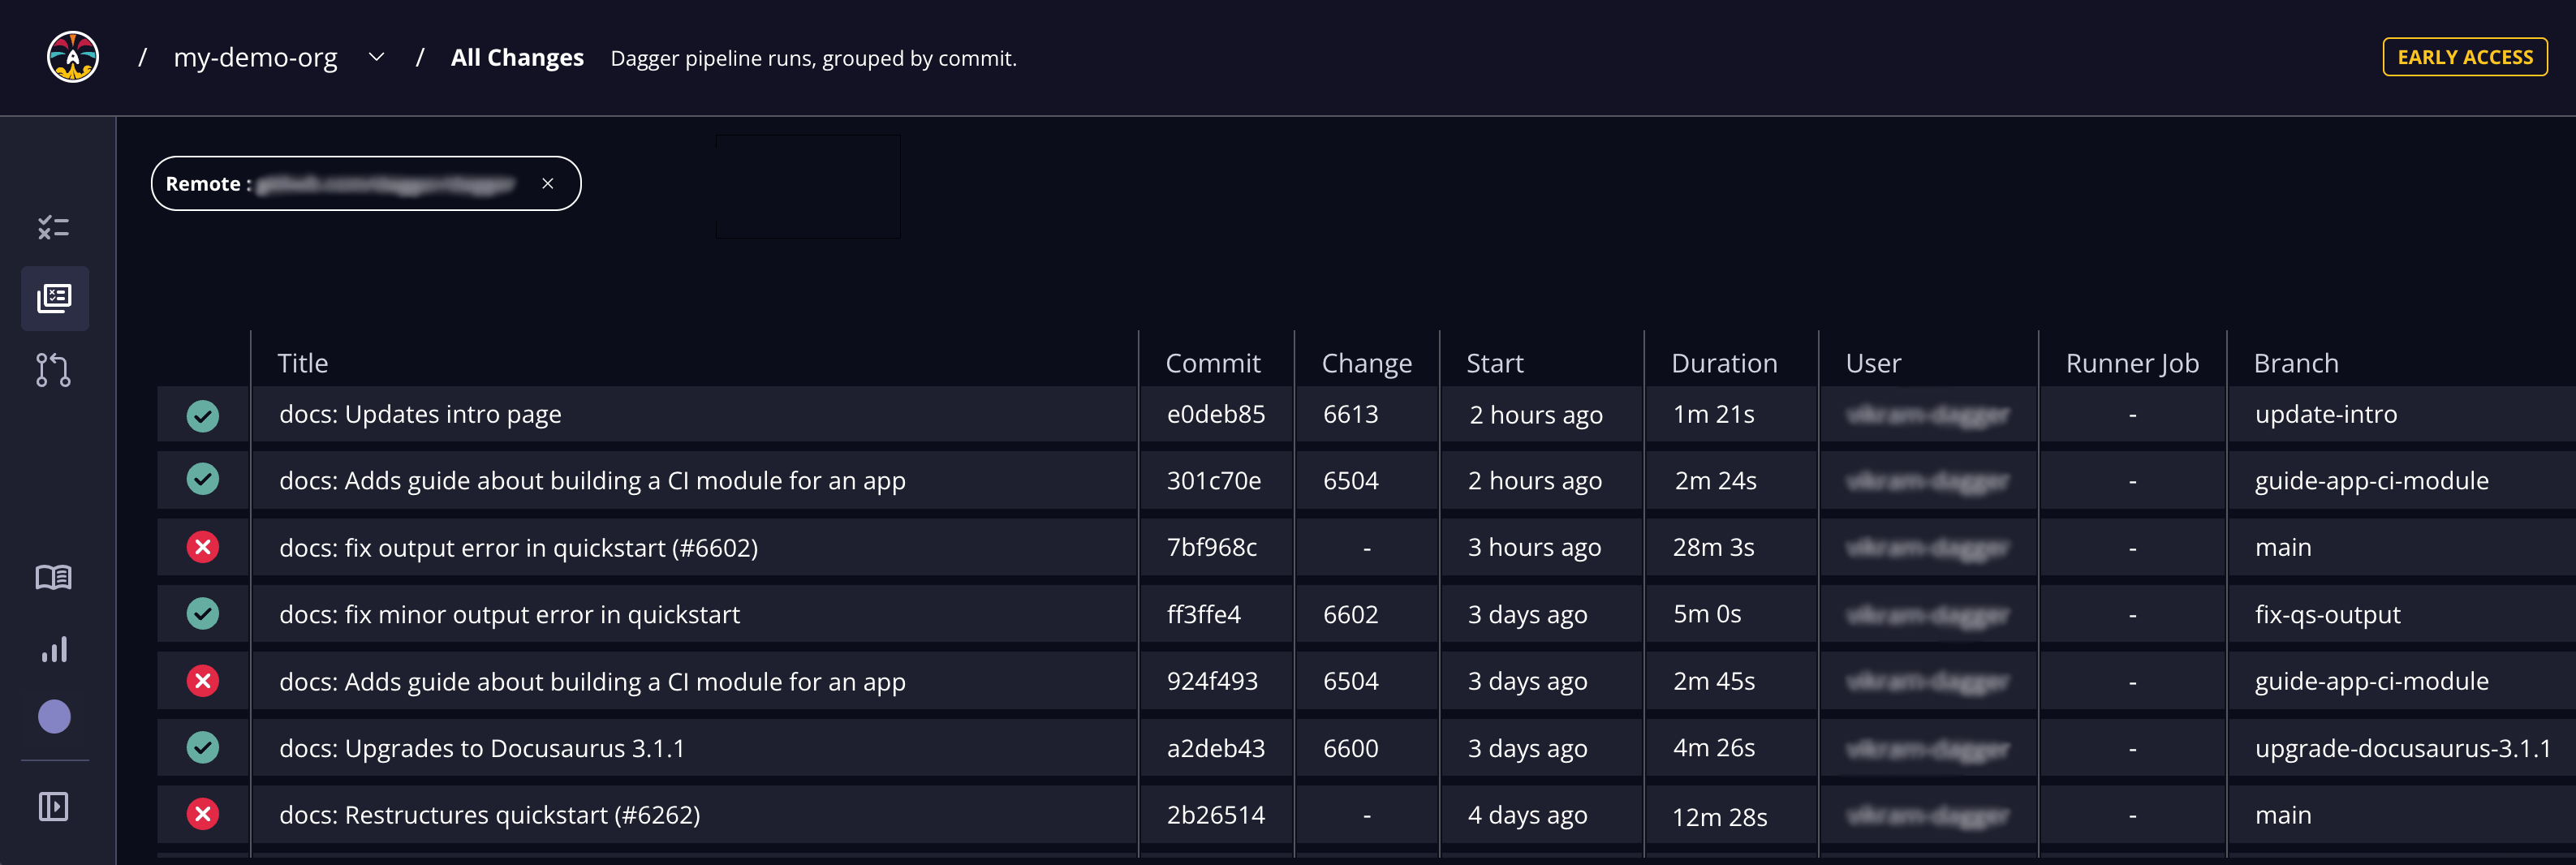
The All Runs page lists available runs.

Here's a quick summary of what you'll see for each run.
| Field | Description |
|---|---|
| Status | Indication of run success or failure |
| Title | Title of the pull request or Change or commit title (abbreviated) |
| Commit | Git commit ID |
| Change | Reference to the pull request or merge request your in source code repository |
| Start | Run start time |
| Duration | Run duration |
| User | User triggering the run |
| Runner Job | Run ID (first 8 identifying bytes) |
| Branch | Name of the branch in source code repository |
| Remote | Full path to the remote source code repository |
You can display a subset of runs, such as runs related to a specific commit, branch, user or remote, by clicking the Filter icon in the corresponding field of the run list.
Run Details page
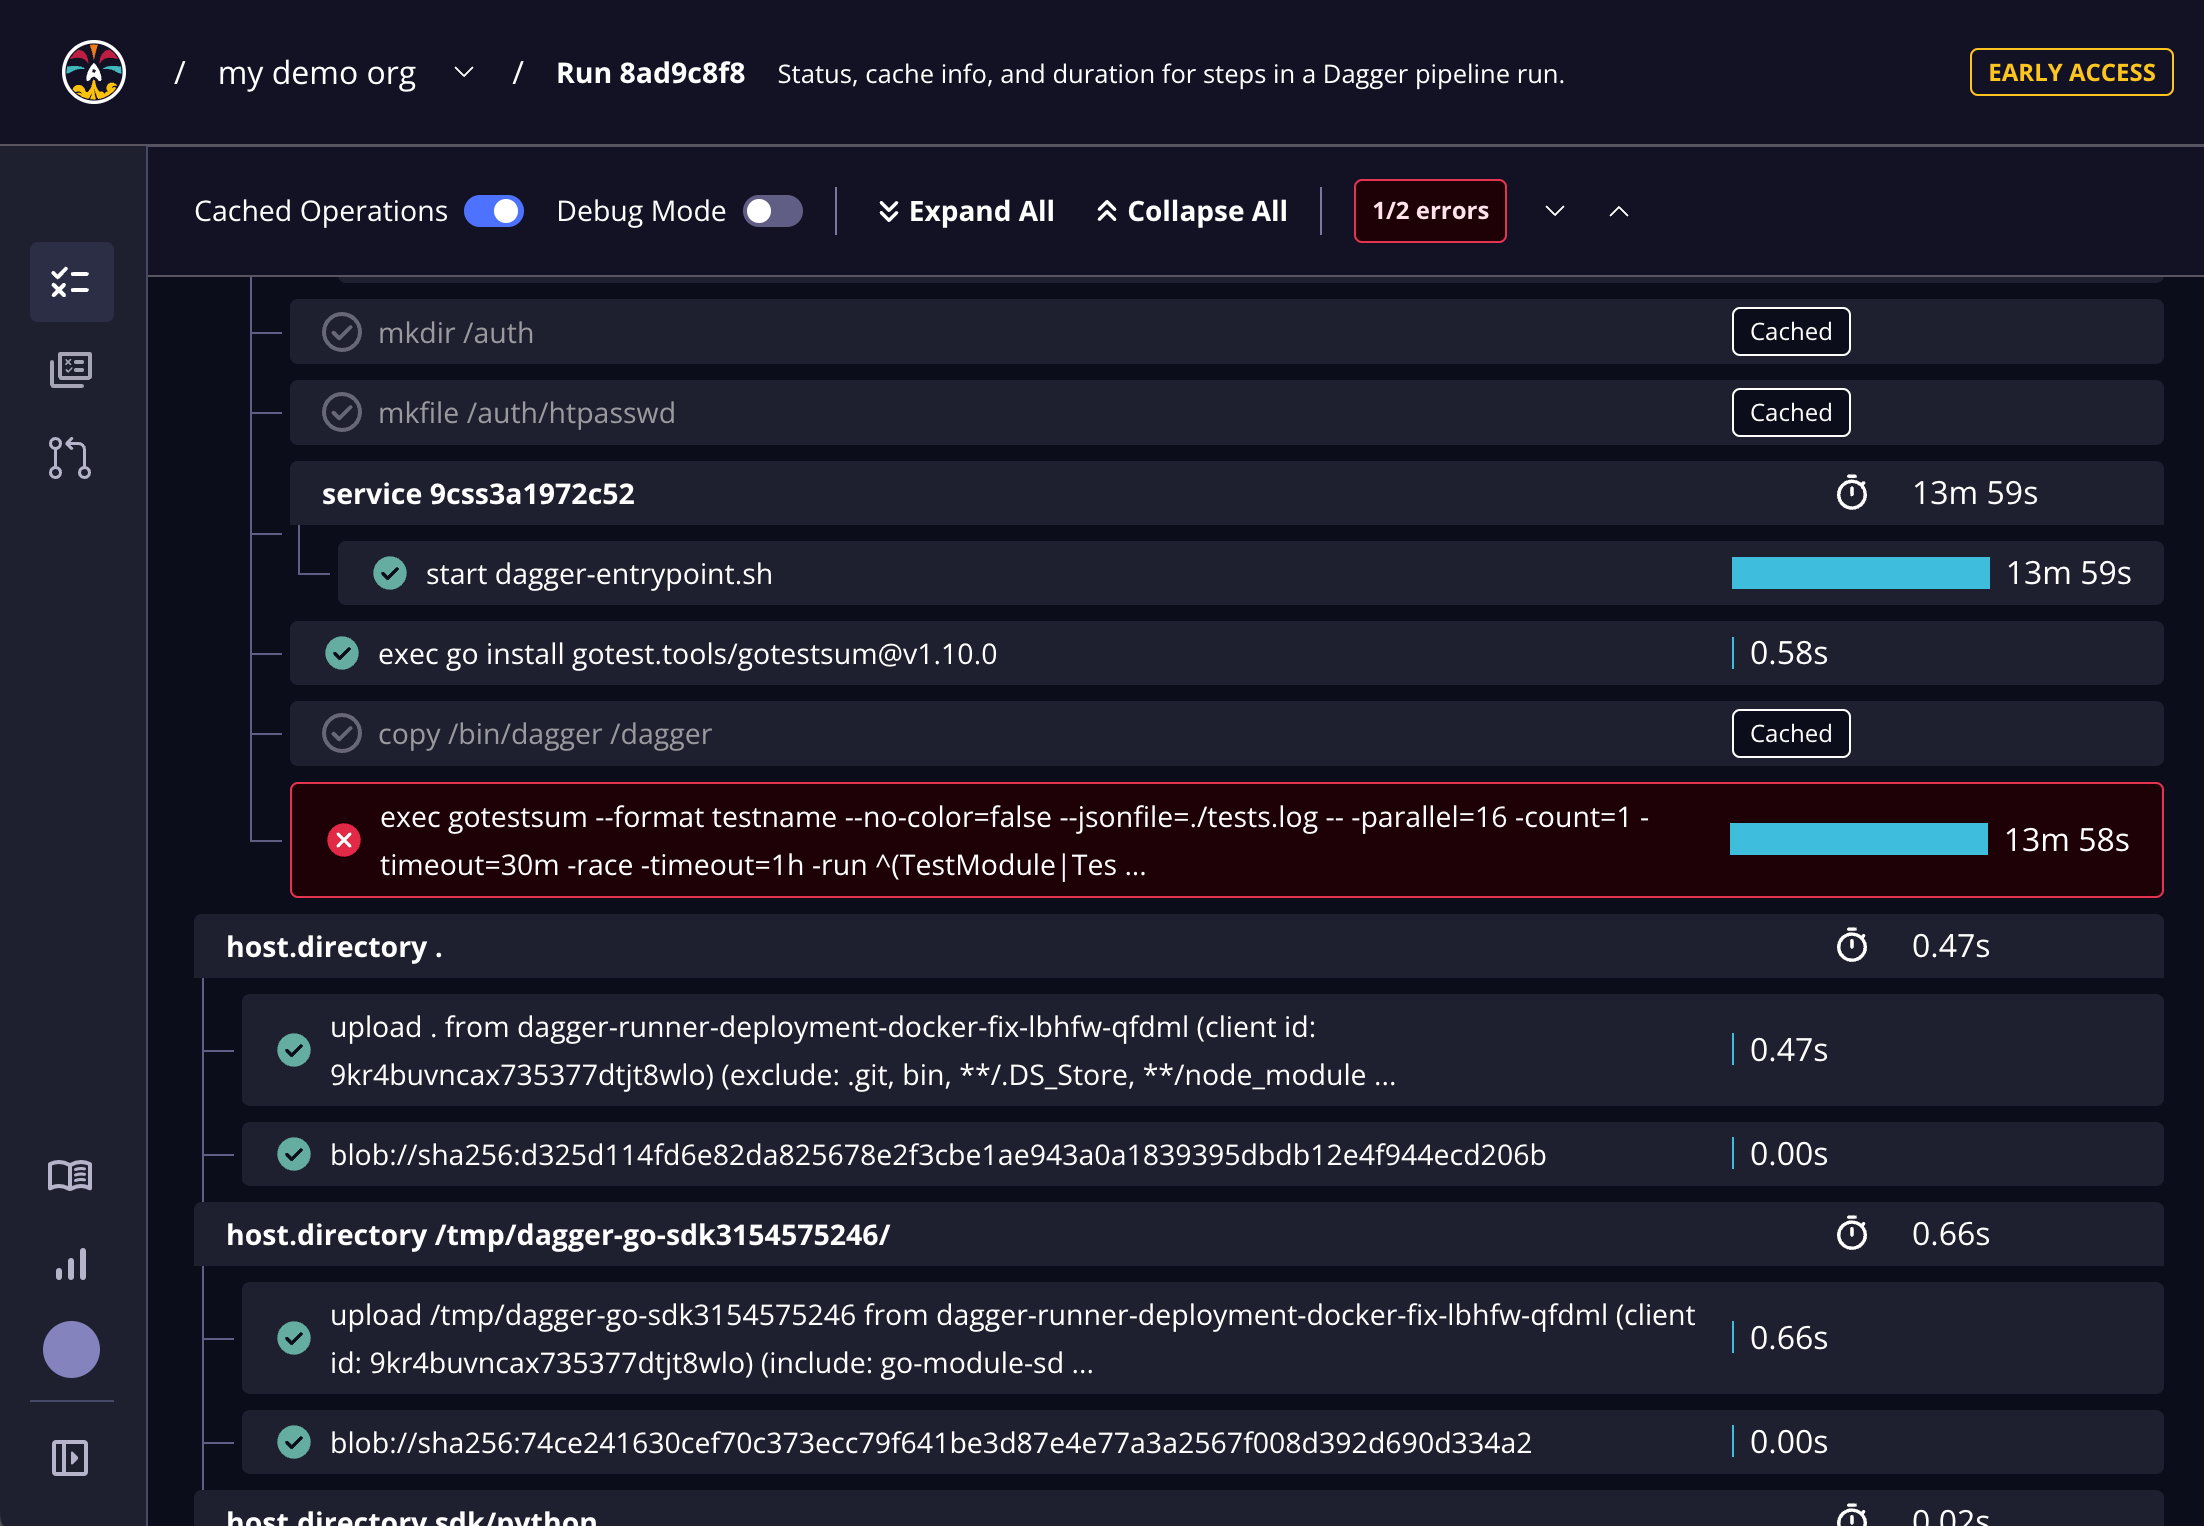
You can drill down into the details of a specific run by clicking it. This directs you to a run-specific Run Details page. When you run Dagger locally, this is the page you visit when you click the Dagger Cloud link in the CLI output.

The Run Details page includes detailed status and duration metadata about the pipeline steps. The tree view shows Dagger pipelines and steps within those pipelines. If there are any errors in the run, Dagger Cloud automatically brings you to the first error in the list. You see detailed logs and output of each step, making it easy for you to debug your pipelines and collaborate with your teammates.
Run Details: Step viewer
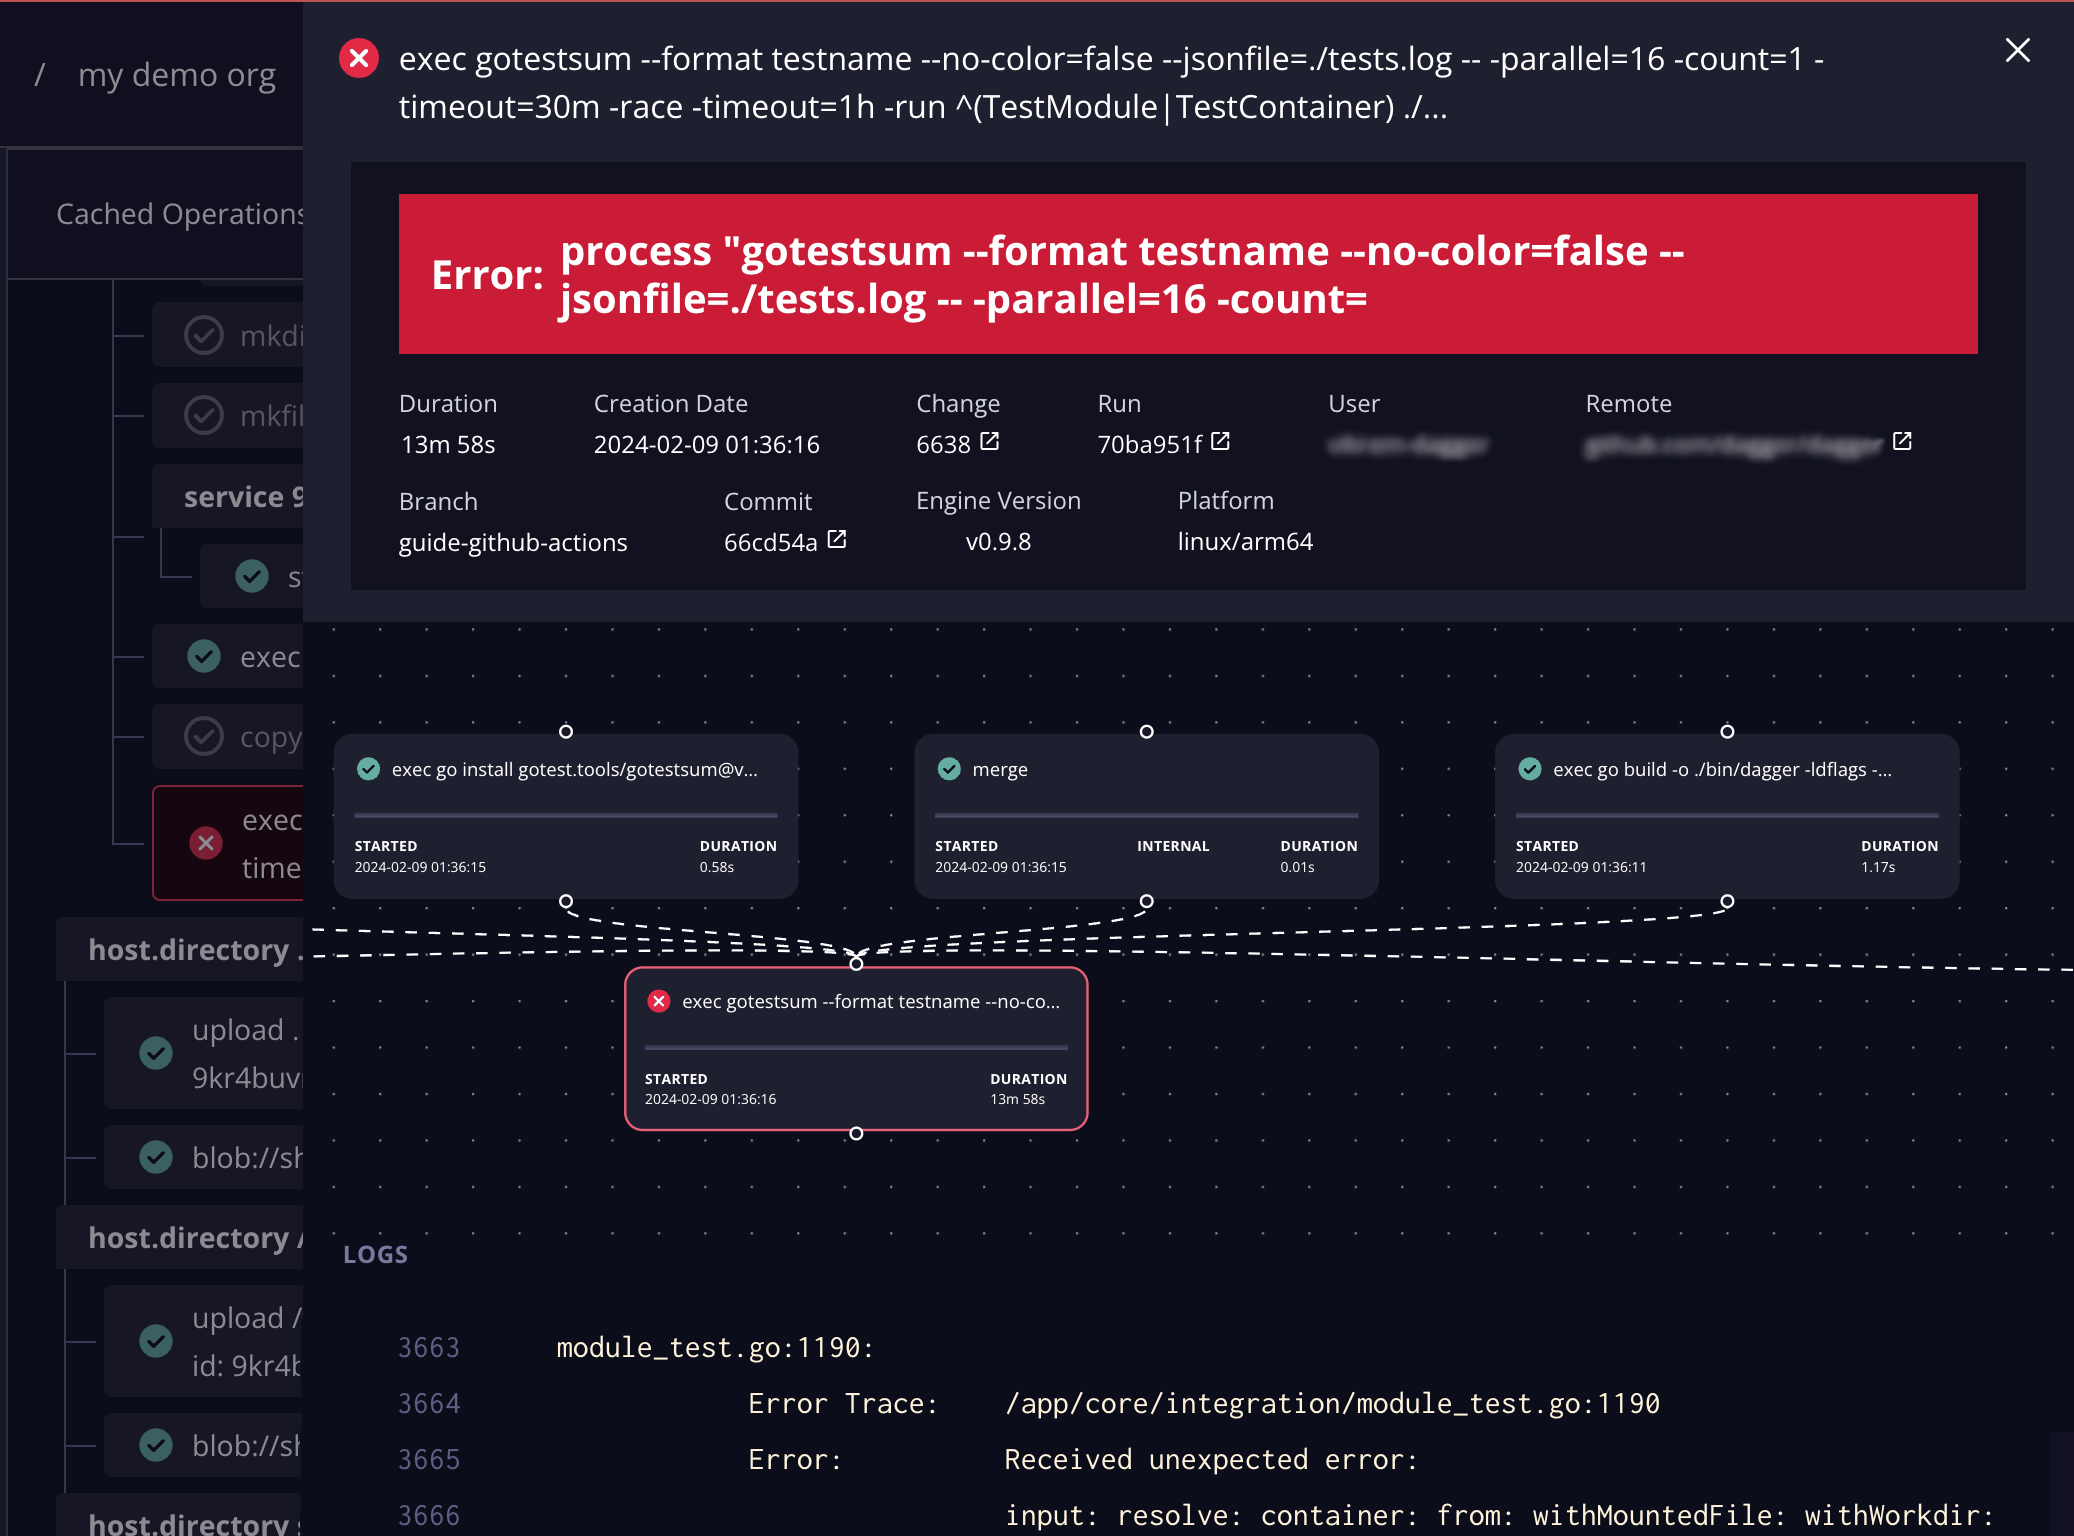
Clicking into a specific step will open a drawer with several elements that can help you debug why your pipeline is failing and help you identify why a step might not have been cached.

Changes
A change is a group of runs for a specific commit or pull/merge request.
All Changes page
The All Changes page lists available groups.

Here's a quick summary of what you'll see for each change.
| Field | Description |
|---|---|
| Status | Indication of run success or failure |
| Title | Change or commit title (abbreviated) |
| Commit | Commit ID |
| Change | Reference to change in source code repository |
| Start | Run start time |
| Duration | Run duration |
| User | User triggering the run |
| Runner Job | Run ID (first 8 identifying bytes) |
| Branch | Name of the branch in source code repository |
| Remote | Full path to the remote source code repository |
Change Details page
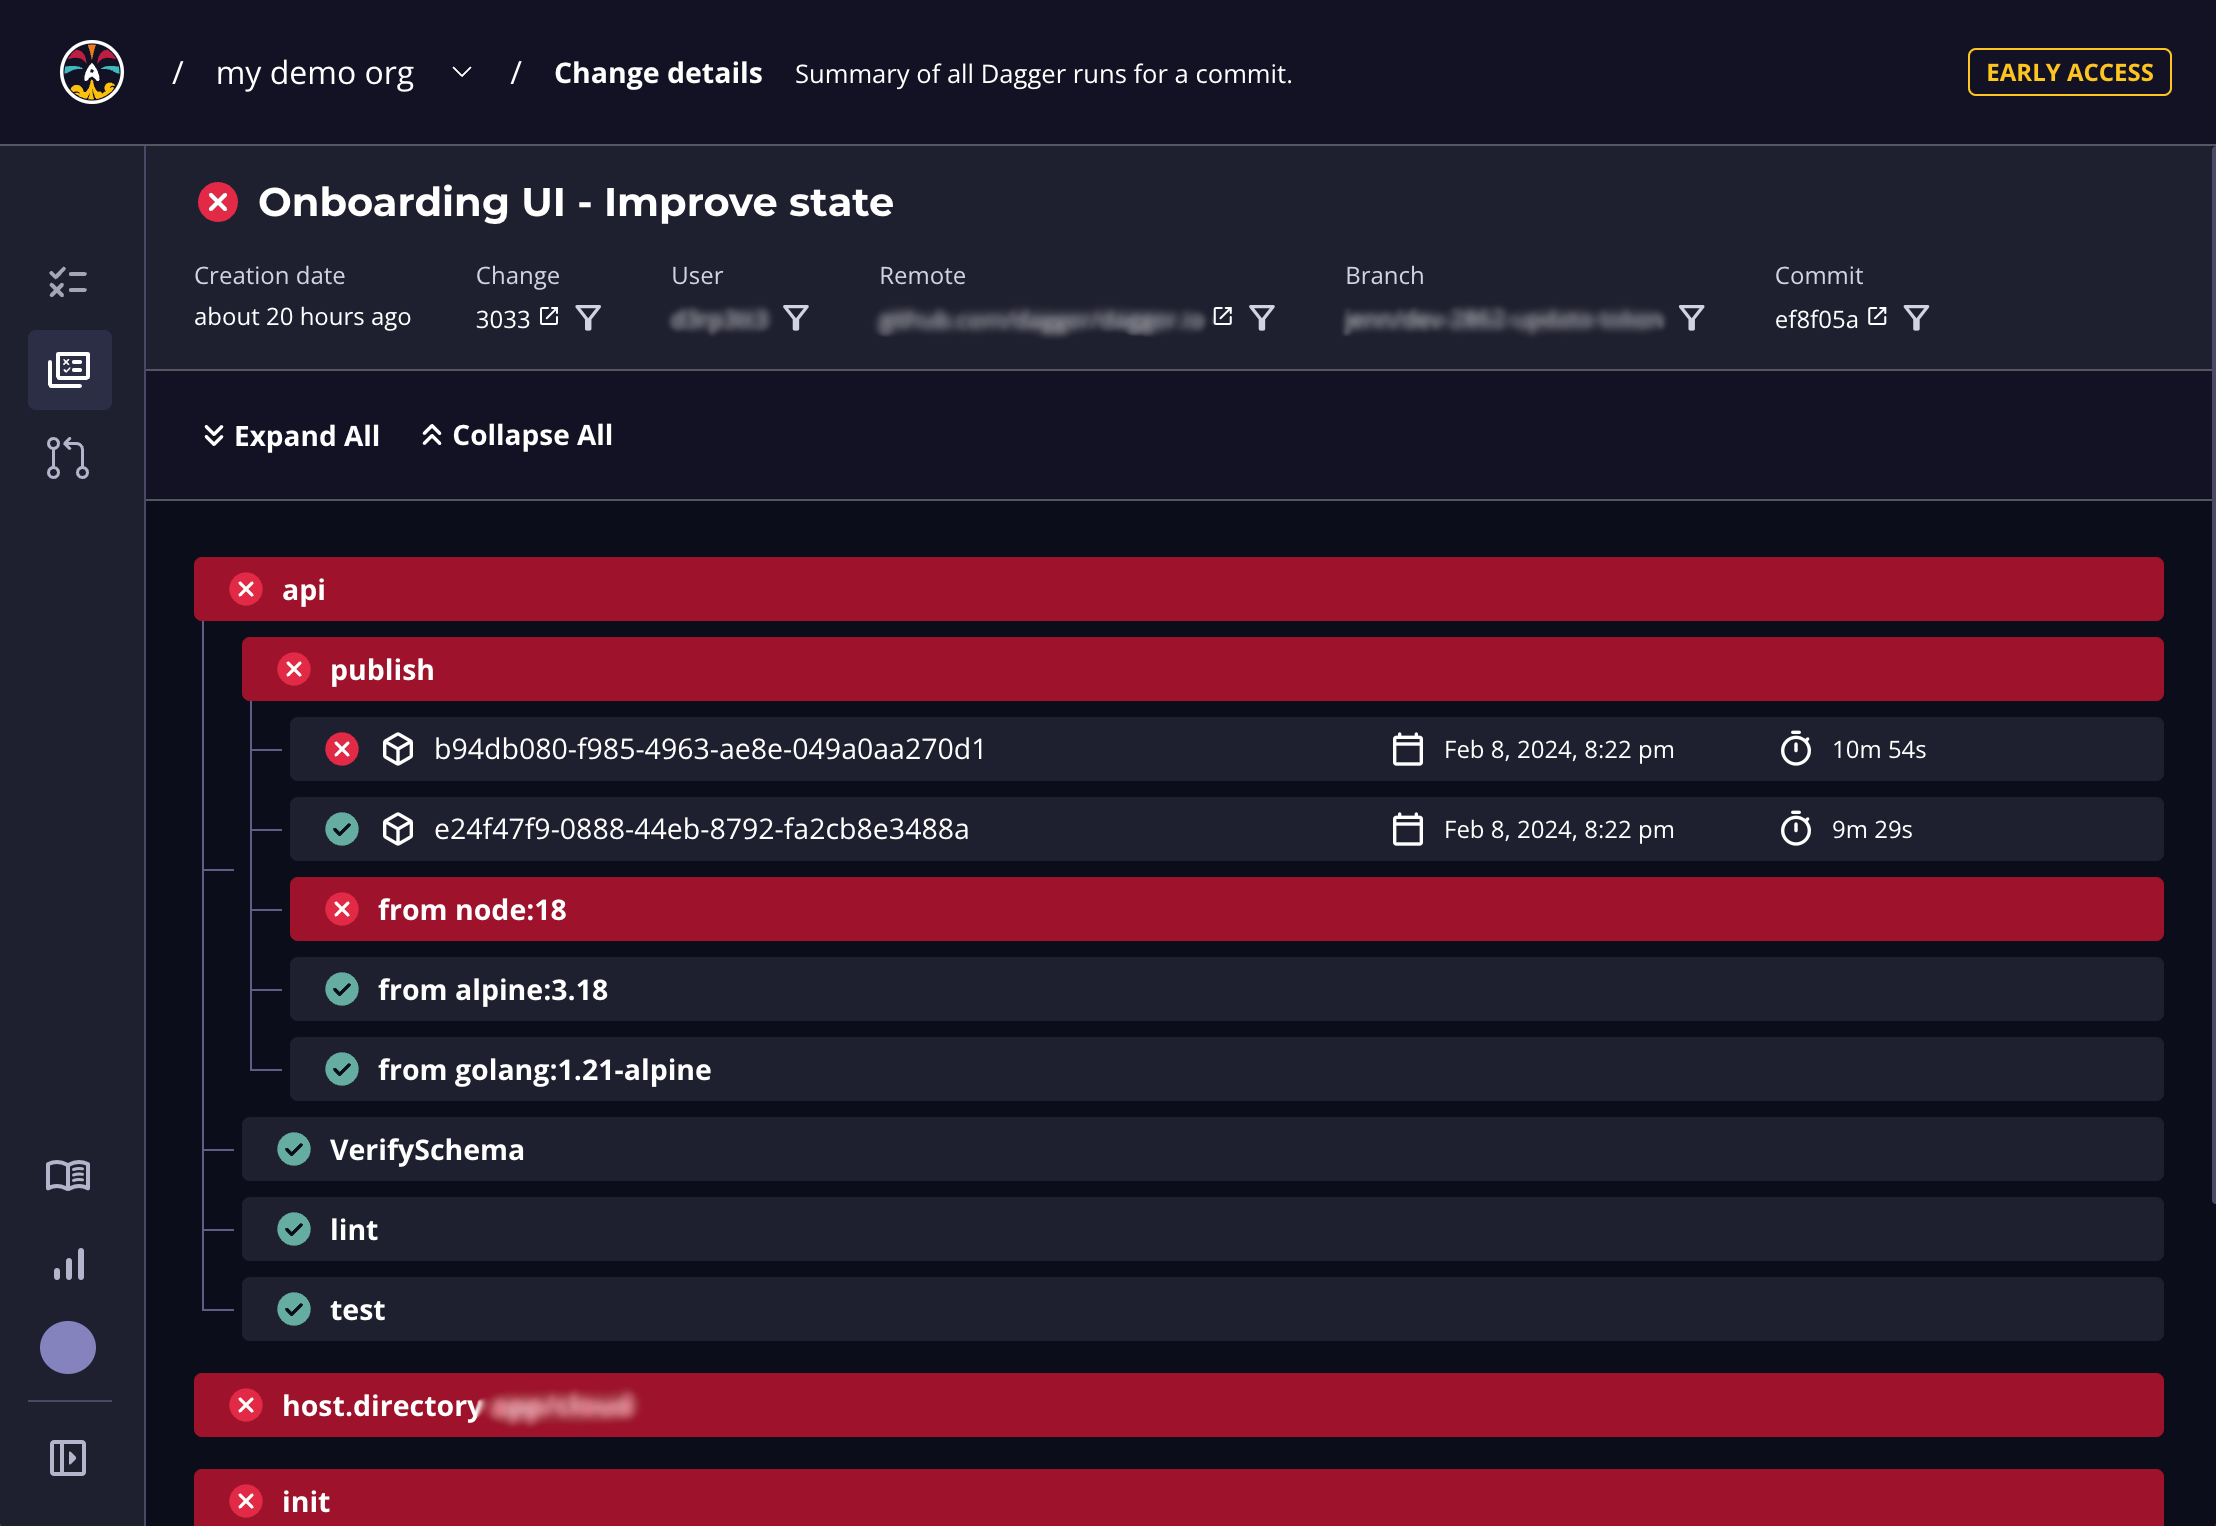
You can drill down into the details of a specific change by clicking it. This directs you to a Change Details page, as shown below:

The Change Details page lists all the pipeline runs for the commit or pull request. The tree view shows Dagger pipelines and detailed logs of steps and outputs within those pipelines. Clicking into a run takes you to the run's details page.